Real-time indicators
Track up-to-date KPIs, without waiting for a manually consolidated monthly report.

From scattered data to informed decisions
We design custom dashboards that consolidate your business data — sales, finance, operations — into clear, actionable indicators. No more manual Excel reports or decisions made blindly: visualize your performance in real time, in a form designed for your teams.
Contact us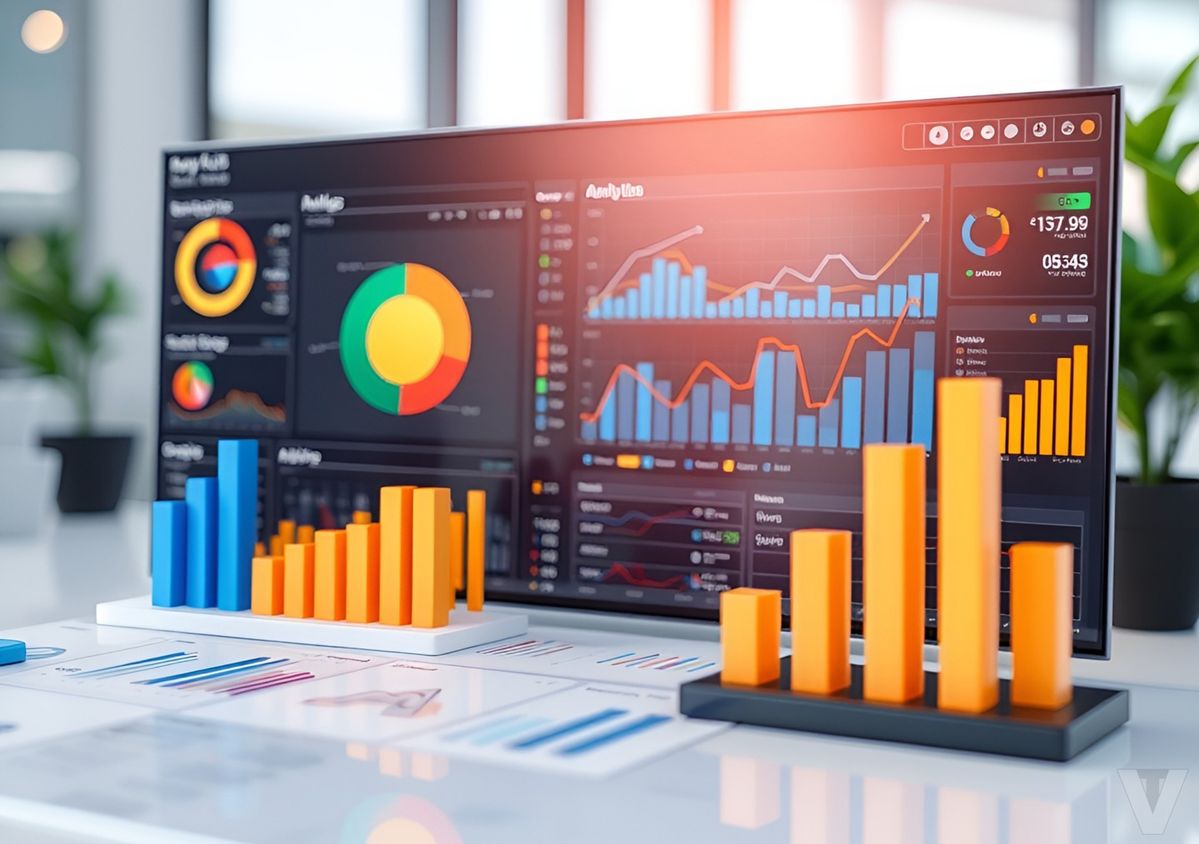
Track up-to-date KPIs, without waiting for a manually consolidated monthly report.
Bring together data from your different tools (ERP, CRM, accounting) in one place.
Visuals designed for your business, tailored to every level of decision-making.
Check your indicators at the office or on the go.
Get notified automatically when a key indicator shows a significant deviation.
Each team sees the indicators relevant to their scope, securely.

From scattered data to informed decisions
We also integrate your existing tools — let's talk about your ecosystem.
Our offers, news and document management tips, straight to your inbox. One e-mail a month at most.
Unsubscribe in one click at any time. Privacy policy
Check your inbox
We've sent you a confirmation link. Click it to complete your sign-up.